
Despite significant advances in vehicle safety, thousands of people are killed on U.S. roads each year. In fact, from 2014 to 2023, over 380,000 people were killed in motor vehicle crashes, with such incidents rising by 25% during the same time period.
In this study, we calculated the yearly fatal crash rate per capita for cities with at least 125,000 residents, using 2023 population estimates and the most recent ten years of available crash data. Our goal was to identify which cities have the most dangerous and safest roads based on this metric. In addition, we included the ten-year percent change for each city to understand how fatal crash patterns are evolving in the area.
Read on to uncover our findings.
Key Takeaways:
- Memphis, Tennessee, recorded the highest annual fatal crash rate (23.98 per 100,000 residents) among all cities in the U.S. with at least 125,000 residents.
- On the opposite end, Cary, North Carolina recorded the lowest fatal crash rate (1.27 per 100,000 residents) among all U.S. cities with at least 125,000 residents.
- Among the nine large metropolitan cities in the U.S. with populations over one million, Dallas, Texas recorded the highest annual fatal crash rate at 13.92 per 100,000 residents. Overall, it ranked 22nd.
Table Of Contents
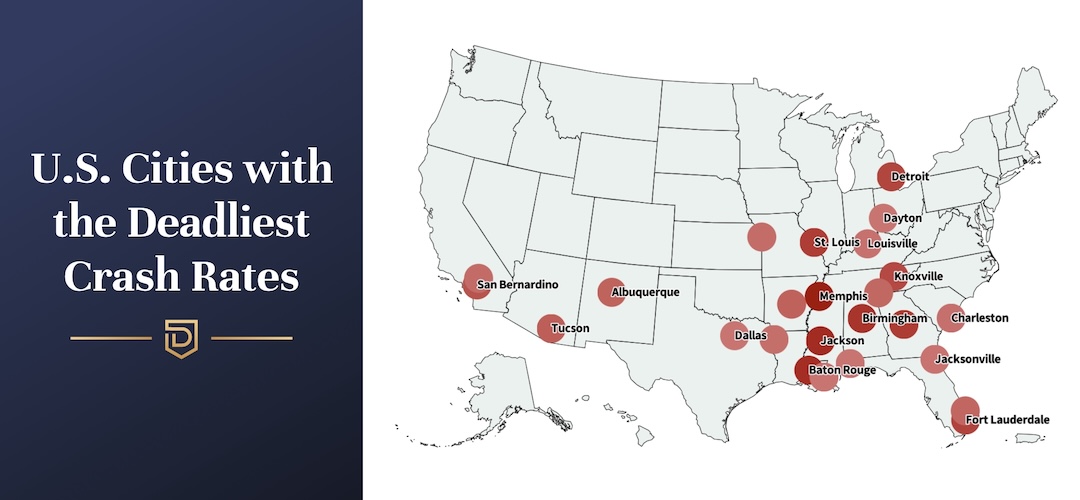
U.S. Cities with the Deadliest Roads
Based on 2023 population estimates, 231 cities in the U.S. have populations over 125,000 residents. The cities listed in the table below represent the top cities by annual crash rate (yearly total fatal crashes for every 100,000 residents).
As more populous states tend to have higher fatal crash counts, this metric allows us to adjust for population size. An interactive point map of these featured cities is also available below for reference.
If you or a loved one was involved in a fatal accident and are considering legal options, you may want to consult with an accident attorney in St. Louis to better understand your rights.
Memphis, Tennessee, exhibited the highest fatal crash rate, with approximately 24 annual fatal crashes per 100,000 residents and a roughly 156% increase over the ten-year study period. Jackson, Mississippi; Baton Rouge, Louisiana; Birmingham, Alabama; and Macon, Georgia also had notably high crash rates. All of these cities are located in the South. In fact, the majority (72%) of the top-ranking cities are in the South, while the Northeast is absent from the top list.
All cities in the top 25 saw increases in crash totals between 2014 and 2023, except for Dayton, Ohio, which experienced no change. Six cities at least doubled their fatal crash totals during this period: Memphis, Tennessee (155.81%); Macon, Georgia (157.14%); Tucson, Arizona (175.51%); Little Rock, Arkansas (183.33%); Knoxville, Tennessee (100%); and Albuquerque, New Mexico (100%).
The top 25 list shows that the highest fatal crash rates are concentrated in midsize southern cities, many of which experienced dramatic increases over the decade. However, the pattern looks different among the largest metropolitan areas, where population size, urban infrastructure, and traffic patterns influence crash rates in other ways.
When we consider only cities with over one million residents (as of 2023), their ranking by yearly fatal crash rate is as follows:
- Dallas, Texas (13.92)
- Phoenix, Arizona (13.87)
- San Antonio, Texas (10.61)
- Houston, Texas (10.61)
- Los Angeles, California (7.38)
- Philadelphia, Pennsylvania (6.90)
- San Diego, California (6.56)
- Chicago, Illinois (5.38)
- New York City, New York (2.61)
Three additional cities grew to over one million residents in 2025. Their fatal crash rates are as follows:
- Jacksonville, Florida (13.96)
- Fort Worth, Texas (9.73)
- Austin, Texas (8.79)
Please note that all fatal crash rates are calculated using 2023 population estimates to align with the crash data.
Memphis, Tennessee, Exhibits the Highest Fatal Crash Rate
As the city with the highest fatal crash rate, we used Memphis to show what this looks like at a local level. The interactive point map below highlights all fatal crashes in Memphis, Tennessee, from 2014 to 2023, including details on the crash year, time, and number of fatalities.
U.S. Cities with the Safest Roads
Here, we look at the top 25 cities with the lowest fatal crash rates. These cities are part of the same sample of cities that we analyzed above. The table and interactive point map below may be referenced with the same information as those found above.
Among all cities with at least 125,000 residents, Cary, North Carolina, exhibited the lowest fatal crash rate, with 1.27 annual fatal crashes per 100,000 residents. Like Memphis, Cary experienced a 150% increase in fatal crashes between 2014 and 2023, showing that significant increases can occur in cities at both ends of the traffic safety spectrum.
Other notable cities with some of the lowest fatal crash rates include Boston, Massachusetts (3.17), and New York City (2.61). Both cities have dense urban populations and high public transit activity, which are factors that likely contribute to their lower rates of fatal accidents and wrongful deaths.
Seven cities experienced a decrease in fatal crashes, and three experienced no change over the ten-year period. Interestingly, eight cities experienced an increase of at least double their 2014 totals; however, because baseline crash counts are low, even a small increase can result in a large percent change.
The full ranking is available below.
Methodology
We analyzed any city or town that was included in Census data and reported at least 125,000 residents as of 2023 estimates. Using FARS data, we compiled all crashes in that city and calculated the rate per 100,000 residents.
Fair Use Statement
If you know someone who may find the study interesting, please feel free to share. We simply ask that any publication of our findings include a link back to the study so readers can reference the full findings and methodology.
Ω